The basics of Google Analytics
Posted in Apps and mobile devices
Google Analytics is a helpful analytical tool to measure the performance of your website. The main advantages of the platform is that it is relatively easy to use, yet powerful and free. It offers a variety of metrics and dimensions with which to categorise and compare with respect to your website. There are basic-level analyses that you can do, but Google Analytics also allows for more advanced analysis. Other tools that Google Analytics provides such as data visualisation, monitoring, reporting, and predictions.
To get the basic terminology out of the way, let’s go through two key terms:
- Metric: A quantitative standard of measuring.
- Dimension: A qualitative label to organise data.
As an example, the number of visitors to your site would be a metric. You can then organise those visitors by the days of the week. This will then tell you how many visitors come to your website for each day of the week. There are hundreds of combinations of dimensions and metrics that may be useful for analysts and many that won’t. It is all about what kinds of data you are interested in.
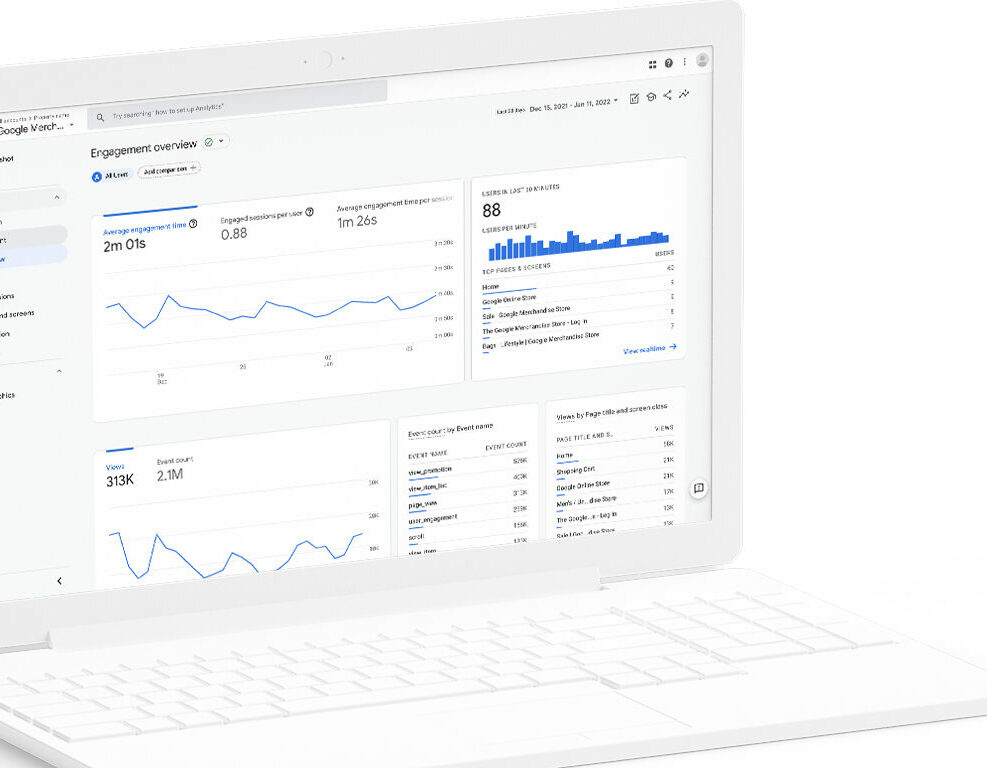
Let’s take a look at a few broad categories of reports Google Analytics displays on the left-hand side of the page…
Realtime
This shows the number of users on your website at this very moment. Any real-time activity is displayed here. Overview will show you the top performing pages currently, where your users are coming from, what country they are from, and how many there are. This is where you will find all the information you would find under any of the other menus but in real-time.
Audience
This gives you a breakdown of your website traffic. If you want to break down the demographics of your website visitors, this is the section you need to be in. Further dropdown menus allow you to fine-tune what sort of visitor information you want to analyse. Under demographics, you can organise your traffic based on age and gender. With the geo report, you can see which countries form part of your traffic and at what proportion. Using this data will allow you to cater your landing pages to each country. Under the mobile section, you can see which devices your visitors are using to access your website. This can help you to optimise your webpages if specific devices are being used to access them.
Acquisition
This is essentially there to show you how traffic reaches your website. If you want to analyse any sort of data regarding outside behaviour onto your website, this is the place to do it. Simply, Google Analytics divides your acquisitions into four categories:
- Organic search: This is any acquisition that arises directly from a search engine’s results page.
- Social: Direct links from social media platforms will fall under this.
- Referral: This is from links on other websites that link directly to yours besides the above.
- Direct: Going directly to your website via bookmarks or typing the URL goes here as well as any acquisition that does not fit the above or when Google cannot determine where the visitor came from.
Source/Medium will show this general organisation of acquisitions. Treemap allows you to display this data visually. Referrals displays the exact URLs that are bringing traffic to your website. The acquisition reports is great for determining where to best spend your time. If 70% of your traffic comes from Twitter and 10% comes from LinkedIn then you know where to spend your time depending on whether you care for more traffic from LinkedIn or not. If your organic search traffic is lacking volume, then focus more on search engine optimisation.
Behaviour
Want to figure out what people are doing on your website? Well, the behaviour report is probably the best place to do so. In its overview you can see what visitors are generally doing.
- Pageviews is how many visits your website gets.
- Unique pageviews are how many users have visited your website at least once.
- Average time on page is exactly as it is described; it displays the average time users spend on your webpages.
- Bounce rate is how many visitors enter a webpage and leave without interacting with anything.
- Percentage exit is how many users leave your webpage (typically more useful on sets of pages instead of the whole website).
Besides these metrics, you can see your best performing pages.
Behaviour flow will allow you to see the journey of visitors through your website from entry to exit. Site content will basically allow you to see how each page is performing. There are no hard and fast rules for what any of the metrics should ideally look like. In terms of bounce rate, which pages it matters on differs. A 404 error page would be expected to have a high bounce rate, but if your landing pages suffer from a high bounce rate it is usually indicative that your page was not what people are looking for, especially from organic searches.
Under Site Search, search terms and search pages indicate searching behaviour on your site. Terms shows what terms are being searched on your site. Percentage exit indicates how many people click off from the search results. Perhaps your website does not answer a question that they had. Pages are where people are starting searches. If users are starting searches from a product landing page maybe it does not live up to what they were looking for.
Conversion
Lastly, this shows you how your conversions are going. A conversion is any sort of activity that is done on your site – downloading, buying, subscribing etc. This section requires a bit more explanation, but the goals report and the e-commerce report are the two most essential sections here. Goals allows you to mark specific conversions under a readable label and group them. The e-commerce report keeps track of product performance, buying time, order size, and sales performance.